As-Built vs. Design: Using Point Clouds for Precise Deviation Analysis and Construction Validation
Verifying built work against design intent with point clouds is a practical, high-value step in modern construction quality control. Point clouds—dense collections of XYZ measurements captured by 3D laser scanners or photogrammetry—recreate the jobsite with millimeter-level detail so teams can run automated deviation checks against BIM models. Below we walk through what as-built vs. design comparisons look like, how point-cloud captures enable reliable verification, the operational workflow for deviation analysis, recommended tools, and the schedule and cost benefits of catching issues early. You’ll also get hands-on guidance for capture and processing, tips for reading heatmaps and reports, and interoperability choices that reduce manual handoffs. Throughout, we include practitioner advice and brief context on provider roles to help teams adopt workflows that cut rework and produce defensible handover documentation.
What Is As-Built to Design Model Comparison and Why Is It Essential?
As-built to design comparison is the measured process of matching field geometry—captured as point clouds or reconstructed as-built models—against the design model to quantify where the built environment differs from intent. The workflow depends on registering scans to project coordinates, aligning the BIM model, and calculating distance-based deviation metrics that feed heatmaps, contours, and trade-ready reports. The core value is objective, early detection of discrepancies so teams can avoid costly rework, manage compliance, and keep schedules on track. Below are the primary, practical outcomes teams expect from a systematic comparison program.
These points summarize the operational value that motivates adoption and supports measurement-driven decision making.
- Catch dimensional errors early—before they trigger change orders or rework.
- Provide clear pass/fail acceptance outputs for trades and inspectors to speed approvals.
- Create accurate as-built records that support facilities management and digital twin handover.
The sections that follow explain why real-world builds diverge from designs and outline the main stakeholder benefits. Knowing where discrepancies come from makes it easier to design capture and analysis workflows that surface the most important variances.
How Do As-Built Models Differ from Design Models?
Design models show intended geometry and dimensions; as-built captures show what was actually installed on site. Differences stem from site conditions, field changes, change orders, installation tolerances, and gaps in documentation—typical examples include MEP routing offsets, slab thickness variations, or shifted precast elements. Small dimensional drift can lead to clashes, prefabrication issues, or downstream rework if trades build from incorrect assumptions. Measuring the gap between intent and reality lets teams target corrections, update models when needed, and issue clear work directives. Identifying common divergence sources informs capture strategies and comparison workflows that prioritize the variances with the biggest impact.
What Are the Key Benefits of Comparing As-Built and Design Models?
Side-by-side comparisons convert subjective field observations into measurable deviation data that project teams can act on. Typical measurable improvements include fewer RFIs and change orders, reduced onsite rework, and more predictable commissioning and handover. Deliverables from verification—annotated heatmaps, deviation tables, and updated as-built models—also improve operations and simplify digital-twin handoff. The list below summarizes the primary benefits from different stakeholder viewpoints.
- Lower rework and change-order costs by spotting deviations before downstream installations.
- Faster coordination and fewer clashes by applying objective geometry comparisons and trade-specific thresholds.
- Clearer handover documentation for operations teams, supporting accurate asset records and lifecycle planning.
These outcomes explain why teams prioritize point-cloud-driven validation. The next section shows how point cloud capture delivers the fidelity and measurements needed for that analysis.
How Does Point Cloud Technology Enable Accurate As-Built Verification?
Point cloud methods produce dense spatial datasets that represent as-built geometry with XYZ coordinates, intensity, and sometimes color—attributes that let teams compare real surfaces to BIM geometry precisely. Captures come from tripod-mounted LiDAR, mobile SLAM rigs, or drone photogrammetry/LiDAR; each approach balances density, accuracy, coverage, and logistics depending on trade and environment. The major advantage is traceable, repeatable measurement that becomes the authoritative reference for deviation analysis and quality assurance. Reliable verification requires thoughtful capture planning, control strategies, and robust processing that preserve positional integrity across the dataset.
The subsections below define point clouds and describe the processing steps needed to prepare data for comparison. Good capture and preprocessing are the foundation for registration and deviation outputs the team can trust.
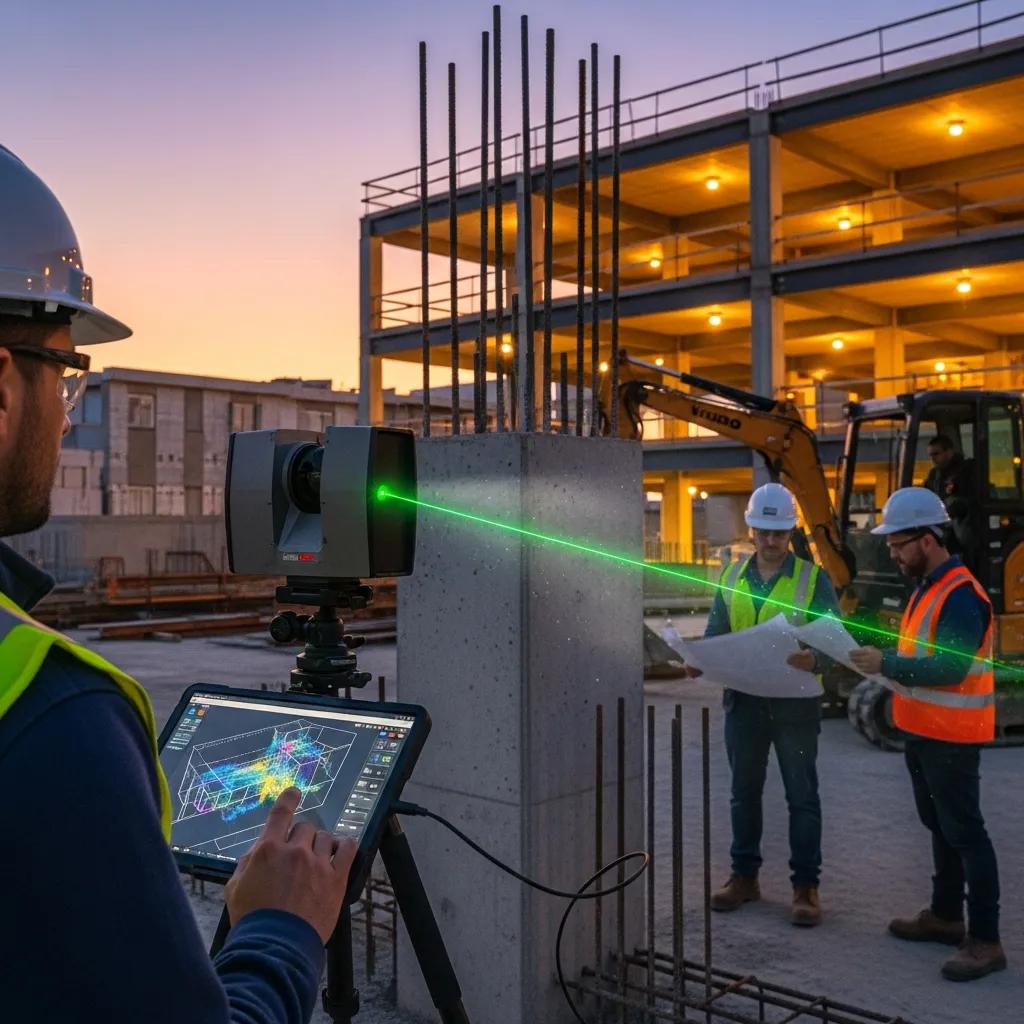
What Is a Point Cloud and How Is It Generated by 3D Laser Scanning?
A point cloud is a dataset of geo-referenced points from range sensors where each point contains coordinates and often reflectance—together they recreate surfaces and volumes of the built environment. Tripod-mounted terrestrial LiDAR captures high-density scans for interiors and critical zones; mobile SLAM systems speed corridor captures; and drones (photogrammetry or LiDAR) cover façades and roofs at varying resolution. Trade-offs include density versus coverage and occlusion challenges in congested MEP areas that require extra setups. Common raw formats include E57, LAS, and proprietary scanner captures, which are then converted into platform-friendly files for processing and analysis.
How Are Point Clouds Processed for Construction Quality Control?
Processing for quality control typically includes registration (aligning multiple scans into one coordinate system), noise filtering, decimation, segmentation, and georeferencing to survey control. From there, surfaces and objects are extracted for model comparison. QA checks focus on registration residuals, control tie-in accuracy with survey measurements, and scan density versus trade tolerances. Segmentation separates slabs, walls, piping, and equipment so deviation checks target the correct BIM elements. A clean, documented processing pipeline makes deviation outputs defensible during contractor review and owner acceptance.
What Are the Step-by-Step Workflows for Deviation Analysis Using Point Clouds?

Deviation analysis follows a repeatable sequence from capture planning through formal reporting, with QA gates at every stage to ensure traceability. Typical steps are: scan planning and control, in-field capture with validation checks, registration and cleanup, alignment to the design model, tolerance-based comparison, visualization (heatmaps and isolines), and delivery of deviation reports for trades and stakeholders. Each step maps inputs to outputs and defines QA responsibilities so teams can scale consistent, reliable procedures across phases and disciplines. The table below lays out the principal workflow steps operational teams use to run dependable deviation analysis.
| Workflow Step | Inputs | Outputs |
|---|---|---|
| Scan Planning | Design drawings, BIM, control points | Capture plan, scanner positions |
| Data Capture | Scanner hardware, control targets | Raw scan files, field validation photos |
| Registration & Cleaning | Raw scans, survey control | Registered point cloud, noise-filtered data |
| Model Alignment & Comparison | Registered cloud, BIM model | Deviation heatmaps, difference metrics |
| Reporting & Handover | Deviation outputs, acceptance criteria | Formal deviation report, updated as-built model |
This mapping clarifies task ownership and shows how QA checks convert raw captures into actionable deliverables. Below we cover practical capture guidance and comparison techniques that translate the workflow into measurable outcomes.
Many projects rely on experienced provider teams to run these steps efficiently; Conway Coordination and Layout Services (CCLS) offers coordinated scan capture, point cloud rendering, and model integration as part of VDC construction services. Our teams combine 3D scanning with survey control and BIM coordination to produce deviation reports that plug into client review cycles, helping reduce rework and improve handoffs.
How Is 3D Laser Scanning Used to Capture As-Built Data?
3D laser scanning is executed by placing scanners where they maximize line-of-sight and by establishing survey-grade control so positional accuracy holds across scans. Capture checklists cover coordinate systems, control targets, scan overlap, appropriate resolution per trade, and validation shots to confirm accuracy during collection. Congested MEP zones or mechanical rooms typically need higher density and extra setups to limit occlusion. Adding robotic total station checks or surveyed control points improves traceability so processed clouds reliably map into the project coordinate system for model comparison.
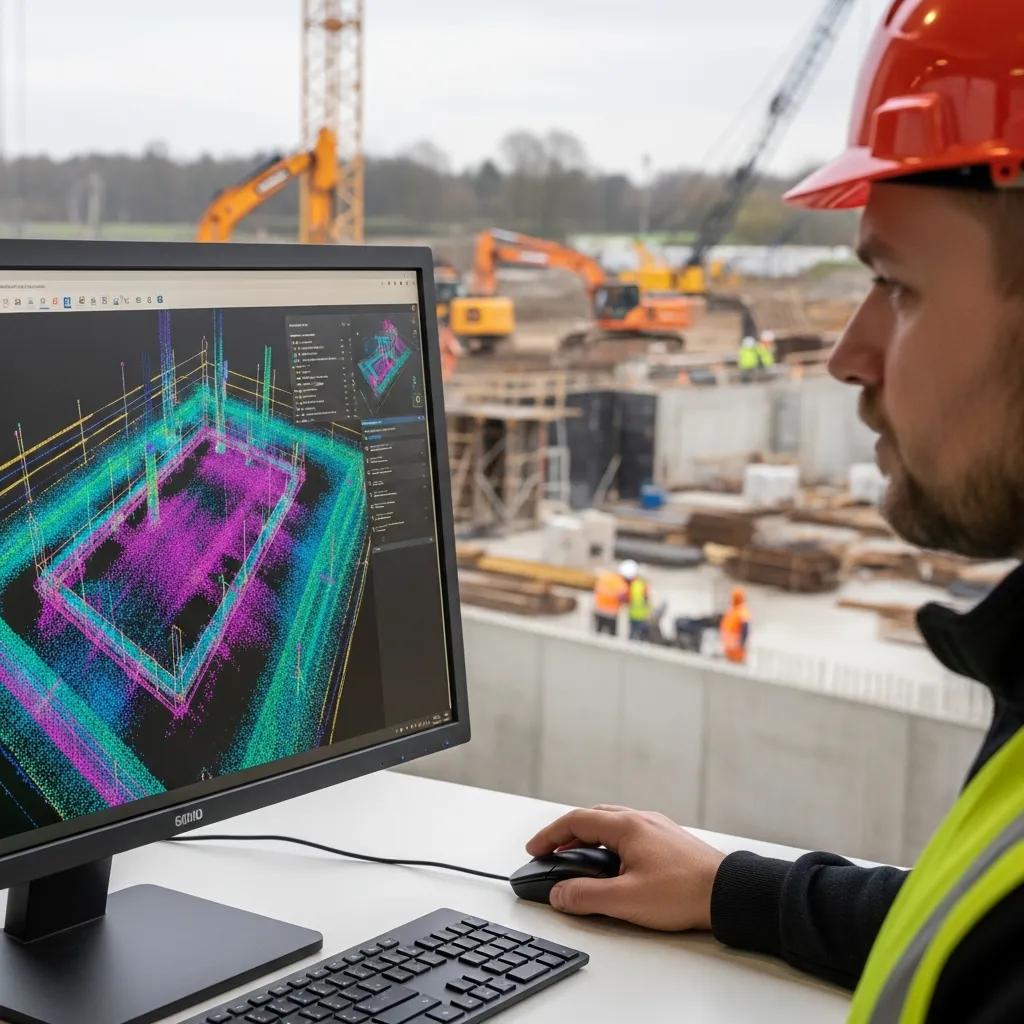
How Are Point Clouds Compared to BIM Design Models for Discrepancy Detection?
Comparison starts by aligning the registered cloud to the BIM coordinate system via control points or best-fit alignment, then running tolerance-based distance checks between cloud points (or derived meshes) and model surfaces. The result: deviation heatmaps, isolines, and summary statistics. Visuals show positive and negative deviations, while automated reports flag out-of-tolerance areas and create tables for field review. Trade-specific extractions return offsets for piping, ductwork, and structural elements. Defining acceptance criteria per trade—typically millimeter or inch thresholds—gives objective pass/fail outputs that drive corrective actions.
Which Software and Tools Are Best for Point Cloud to BIM Model Comparison?
Tool selection depends on project scale, desired automation, and the split between heavy point-cloud processing and BIM authoring. Options range from high-performance point-cloud platforms that handle big datasets and advanced registration to BIM tools with built-in comparison and issue tracking. Key considerations are supported formats (E57, RCP/RCS, LAS), automated deviation reporting, heatmap quality, and cloud collaboration for versioning and stakeholder review. The table below compares representative solutions to help teams pick the right stack for their needs.
| Software | Supported Formats | Best-Use Case |
|---|---|---|
| Autodesk ReCap / Revit | RCP/RCS, E57 | BIM authoring + cloud-markup integration |
| Leica Cyclone | E57, LAS | Heavy-duty point-cloud processing and registration |
| Trimble RealWorks | E57, LAS | Survey-grade registration and automated workflows |
| Cloud-based viewers | LAS, RCP | Collaboration, versioning, and lightweight review |
Many teams combine specialist point-cloud processing with BIM authoring to create an efficient pipeline for deviation reporting. Point-cloud teams handle registration and cleaning, then pass simplified outputs into Revit or other coordination platforms for trade review.
Below are integration practices that reduce manual steps and improve cross-team collaboration.
- Standardize on neutral exchange formats (E57, LAS) for heavy processing and RCP/RCS for Revit handoffs.
- Automate mesh or slice exports to speed heatmap generation and BIM visualization.
- Use cloud versioning to track comparisons, changes, and issue resolution across teams.
Specialist model-integration providers can plug into these toolchains; CCLS delivers 3D rendering and model integration services that align with these stacks and supplies ready-to-use comparison outputs for BIM coordination workflows.
What Are the Leading Software Solutions for Deviation Reporting?
Deviation reporting tools fall into point-cloud-first and BIM-first categories. Point-cloud platforms excel at registration, meshing, and heatmap generation; BIM platforms integrate deviation outputs into design workflows and issue tracking. Reporting features vary—some tools auto-generate deviation tables and annotated views, others export high-fidelity heatmaps or extract offset statistics for MEP trades. For many projects, a hybrid workflow—processing in a point-cloud platform, then bringing results into BIM for coordination—delivers both accuracy and actionable outputs. The table below highlights representative tools and their typical deliverables.
| Tool | Key Feature | Typical Output |
|---|---|---|
| Leica Cyclone | Advanced registration | High-fidelity registered cloud |
| Trimble RealWorks | Survey workflows | Automated deviation reports |
| Autodesk ReCap | Cloud rendering | RCP/RCS export for Revit workflows |
| Cloud viewers | Web collaboration | Versioned review and markup |
Matching tool capabilities to project needs, and planning handoffs carefully, reduces friction between scan processing and BIM coordination. The next section explains how integration removes manual steps and supports continuous validation.
How Does Software Integration Improve Construction Validation Workflows?
Tighter software integration automates file conversions, aligns registration outputs to BIM coordinates, and enables cloud review workflows that cut repeated export/import tasks. Integrated pipelines let teams run continuous validation at key milestones—updated scans can be compared quickly to the latest design, and issues can flow automatically into coordination platforms. That lowers the risk of mismatched datasets, decreases manual alignment time, and supports a digital-twin approach where verified as-built data becomes the operational reference. A consistent toolchain and automated reporting let teams scale verification across phases with predictable QA cycles.
How Does As-Built Verification Reduce Construction Rework and Costs?
Verifying as-built geometry early reduces rework and cost by surfacing deviations when fixes are cheapest, enabling prefabrication checks, and preventing cascading trade errors that multiply labor and material waste. Early detection shortens decision cycles, provides measurable evidence for scope changes, and lowers dispute risk by creating auditable deviation records. To choose the right verification intensity, teams should compare detection speed, accuracy, and savings potential across methods. The table below summarizes common approaches.
| Method | Detection Speed | Typical Accuracy | Typical Savings |
|---|---|---|---|
| Visual field inspections | Slow | Low | Moderate risk reduction |
| Traditional survey checks | Moderate | High | Moderate savings via targeted fixes |
| Full point-cloud comparison | Fast | High (mm-level) | High savings from avoided rework |
The table shows that full point-cloud comparisons offer faster detection and high accuracy, which often translates into larger savings by preventing costly downstream corrections. The following sections quantify financial benefits and show how validation improves schedule adherence.
What Financial Benefits Result from Early Detection of Design Vs As-Built Discrepancies?
Fixing issues early delivers direct labor and material savings by avoiding demolition and reinstallation. Secondary savings include fewer delay claims, lower contingency draws, and reduced management hours spent coordinating fixes. A simple ROI is avoided rework cost divided by verification cost—on many medium-to-large projects, preventing one major rework event makes proactive scanning pay off. Case studies consistently show measured verification reduces change orders and minimizes commissioning downtime. Those outcomes are why owners and contractors increasingly fund verification earlier in the schedule.
How Does Accurate Validation Enhance Project Schedule Adherence?
Accurate validation reduces uncertainty that creates schedule bottlenecks and trade sequencing delays. Verified geometry lets prefabrication proceed with confidence, reduces onsite adjustments, and enables parallel workstreams that compress critical paths. Faster verification cycles lower inspection and acceptance hold-ups, helping projects meet milestones and deliver on time. When deviation reporting feeds coordination meetings, teams resolve conflicts before field crews are mobilized—preserving schedule continuity and improving on-time delivery rates.
What Are Industry-Specific Applications of Point Cloud Deviation Analysis?
Point cloud deviation analysis adapts to industry tolerances, regulatory drivers, and operational priorities—useful across healthcare, pharmaceutical, commercial, industrial, manufacturing, and historic preservation projects. Each sector applies slightly different acceptance criteria and deliverables: healthcare focuses on tight MEP tolerances and traceable documentation; industrial projects prioritize equipment fit and safety-critical alignment. Deliverables can include annotated heatmaps, as-built BIM exports, fabrication-ready coordinates, or certified deviation reports for regulatory review. The list below highlights common, industry-tailored deliverables and benefits.
- Healthcare/pharma: compliance-ready deviation reports, detailed MEP coordination deliverables, and documented acceptance criteria.
- Commercial/industrial: prefabrication-ready geometry, equipment alignment checks, and safety-critical tolerance verification.
- Historic preservation: high-resolution scans for conservation mapping and accurate digital twins for archival records.
Knowing these drivers helps teams set capture density, tolerance thresholds, and reporting formats appropriately. The subsections that follow explore healthcare/pharma and commercial/industrial specifics and explain typical provider deliverables.
How Is As-Built Validation Applied in Healthcare and Pharmaceutical Facilities?
In healthcare and pharma projects, validation runs to strict tolerances with rigorous documentation and traceable control to meet regulatory and commissioning requirements. Common tasks include validating MEP penetrations, equipment alignment, cleanroom interfaces, and documenting intent-versus-built for commissioning teams. Deliverables often include certified deviation tables, annotated floor-level heatmaps, and BIM exports for commissioning and operations handover. Because these projects are MEP-heavy and compliance-driven, workflows emphasize survey-grade control, fine segmentation, and acceptance reporting that supports audits and operational readiness.
What Are the Benefits for Commercial and Industrial Construction Projects?
Commercial and industrial projects gain better coordination at scale, fewer cascading errors across trades, and closer alignment between prefabrication geometry and site reality. For large facilities, accurate as-built models enable modular construction and off-site fabrication with confidence that components will fit at install. Validation also supports safety planning, phased sequencing, and reliable asset records for operations. Providers that pair point cloud capture with BIM coordination and VDC workflows help teams reduce installation delays and deliver as-built models that serve facilities management across the asset lifecycle.
On complex projects, service providers that combine precise layout technology—like robotic total-station workflows—with advanced 3D scanning and VDC coordination bring tangible value by reducing rework and simplifying handover. Conway Coordination and Layout Services (CCLS), led by Founder and Lead Coordinator Nathan Conway, offers these combined capabilities as a family-owned provider focused on precision layout, 3D scanning, point cloud rendering, and model integration to support verified construction outcomes.
- Request a consultation: If you’re planning point-cloud-driven validation, a consultation clarifies capture strategy, toolchain choices, and expected ROI.
- Define acceptance criteria: Set trade-specific tolerances early and match capture density to those thresholds to maximize verification value.
- Plan for integration: Make sure processed outputs are compatible with the BIM and VDC platforms your teams use for smooth handoff and review.
Following these steps helps teams turn verification outputs into less rework, better schedule adherence, and verified handover documentation that supports ongoing operations.
Frequently Asked Questions
What are the common challenges faced during as-built to design model comparisons?
Typical challenges include variable data quality (scan noise or incomplete coverage), misaligned scans, and undocumented field changes. Teams also run into software interoperability gaps that create extra manual work. Addressing these issues means planning capture carefully, enforcing robust processing and QA, and keeping clear communication across design, survey, and construction teams so comparisons are accurate and discrepancies get resolved efficiently.
How can teams ensure the accuracy of point cloud data before comparison?
Accuracy starts with a QA-minded capture plan: set up reliable control points, verify overlap and resolution for each trade, and run in-field validation checks. Post-capture, perform registration, georeferencing, and residual analysis to confirm positional integrity. Clean filtering and clear documentation of processing steps help ensure the point cloud is trustworthy for comparison against the design model.
What role does training play in effective point cloud analysis?
Training is essential. Operators need hands-on experience with scanners, processing software, and interpretation of deviation outputs. Structured training—covering capture best practices, software workflows, and QA checks—reduces errors and improves turnaround. Ongoing skill development keeps teams current with new tools and methods that make analysis faster and more reliable.
How do industry standards influence as-built verification processes?
Standards set expectations for accuracy, documentation, and compliance. They help define acceptable tolerances and reporting requirements so verification outputs meet regulatory and contractual needs. Following relevant standards reduces risk, ensures consistency across projects, and simplifies collaboration between stakeholders. Teams should stay current with standards relevant to their sector and project scope.
What are the implications of not conducting as-built to design comparisons?
Skipping as-built comparisons risks unnoticed discrepancies that can lead to expensive rework, schedule delays, and compromised quality. Lack of accurate as-built documentation also creates problems for future maintenance and operations. In short, forgoing comparison increases financial and operational risk across the project lifecycle.
How can technology advancements improve point cloud analysis in construction?
New hardware and software are making capture faster and analysis smarter. Higher-resolution LiDAR, improved SLAM systems, cloud processing, and machine-learning tools speed segmentation and anomaly detection. Better web-based viewers and automated reporting reduce manual effort, enabling quicker decisions. Leveraging these advancements helps teams get more precise verifications with less friction.
Conclusion
Point-cloud comparison of as-built conditions to design models strengthens construction validation by catching deviations early—reducing rework, protecting schedules, and improving handover documentation. Adopting these verification workflows delivers measurable gains in quality and predictability. If you’d like help integrating point-cloud-driven validation into your project, our team can design the capture plan, select the right tools, and deliver usable deviation reports that fit your coordination processes.